|

Program Flow
Data Flow
Data Set Drill Down
| |
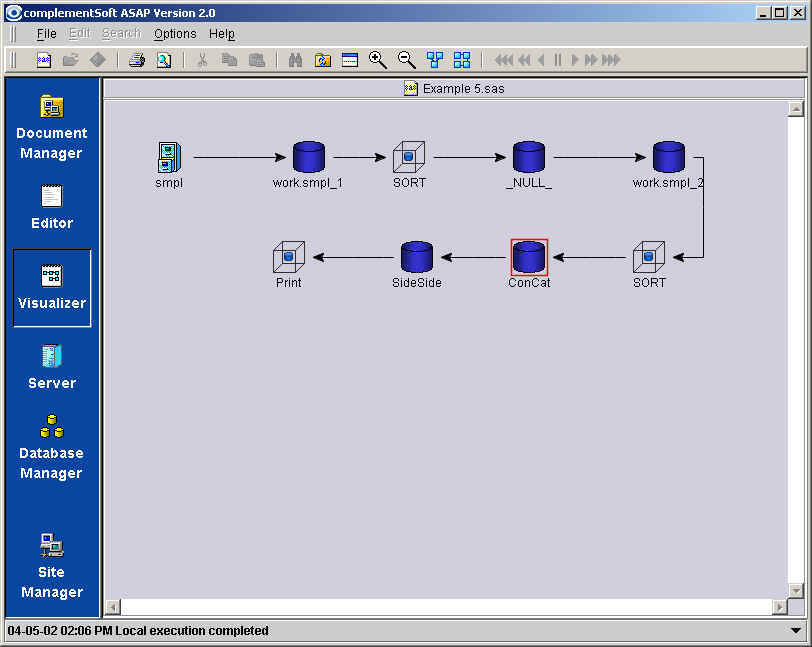
The Visualizer is a graphical, SAS® language-aware program flow and data flow analysis
tool. The Visualizer reads, parses, and displays your source code files, representing each
program and data block with an icon. Arrows connect these icons to show program and
data flows, making them simple to read and understand. Tightly integrated with the
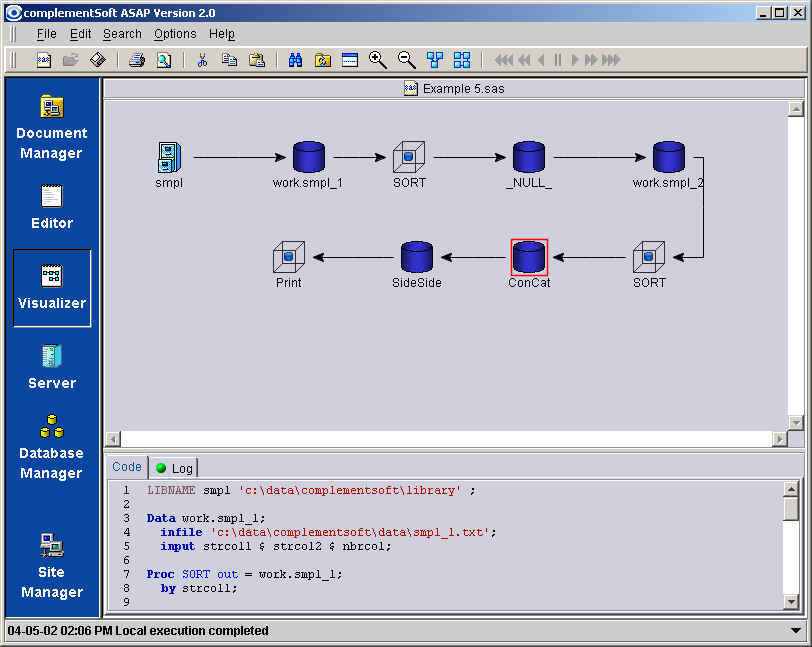
Editor, the Visualizer lets you examine your source files interactively. For
example, while in the split view mode, a user is able to
click on an icon to jump to the actual program code in the editor. Similarly,
changes made in the Editor (either in the split view mode or in the Editor mode) can be
easily reflected in the Visualizer, as well. By clicking on the "Refresh"
icon  on the tool
bar, the visualization instantly reflects the change made in the code. on the tool
bar, the visualization instantly reflects the change made in the code.
Features Map
Menu Bar |
Subfunction |
Functional Description |
File |
New (Ctrl+N) |
Create a new document. |
File |
Open (Ctrl+O) |
Open the selected document. |
| File |
Export |
Export the Visualizer image to a jpg
file. |
| File |
Page Setup |
Sets print paper size, orientation and
margins. |
File |
Print |
Prints the active document. |
File |
Print Preview |
Opens a panel to show you what the
active document will look like when printed. |
File |
Exit (Ctrl+X) |
Exit the program. |
Options |
Visualizer Configuration |
Allows the full statement name to show
in Visualizer label and allows user to set wrap width. |
Help |
About |
|
Toolbar |
Functional Description |
 New New
|
Create a new document. |
 Print Print
|
Print document. |
 Preview Preview
|
Opens a panel to show you what the
active document will look like when printed. |
Refresh |
Refresh tab. |
 Split Split
|
Split the windows to show Visualizer
view and Editor view. |
 Zoom In Zoom In
|
Magnifies active flow. |
 Zoom
Out Zoom
Out
|
Minimizes active flow. |
 Data Flow Data Flow
|
Show data flow diagram. |
 Program Flow Program Flow
|
Show program flow diagram. |
 Fast Combine Fast Combine |
Combine All Data
Flows without animation. |
 Combine All Combine All |
Combine All Data
Flows |
 Combine Combine |
Combine Data Flows in
a step-wise manner. |
 Pause Pause |
Pause the active
combine process. |
 Separate Separate |
Separate Data Flows
in a step-wise manner. |
 Separate All Separate All |
Separate All Data
Flows |
 Fast Separate Fast Separate |
Separate All Data
Flows without animation. |

| |
|